
Download Data
On this page, you can download spatial data acquired within the TAČR project “Solar Potential of the Ústí Region: Data Backgrounds for the Development of Future Methodologies and Frameworks in the Energy Sector; TK05010152”.
The data include three different products:
- Point cloud from airborne laser scanning
- Digital surface model capturing terrain and all above-ground objects
- Solar potential model layers for rooftops quantifying incoming global solar radiation.
The data cover the territory of the Ústí Region and are intended for scientific, professional, and applied use in the field of relief, landscape, and spatial structure analysis. More information can be found in the Methodology section.
The data are provided under the Creative Commons Attribution 4.0 International (CC BY 4.0) license.
Point Cloud from LLS
Airborne laser scanning is a modern remote sensing method that uses laser pulses emitted from a sensor mounted on an aircraft to accurately determine the distance between the sensor and the Earth’s surface. Based on these measurements, a detailed three-dimensional representation of the terrain and objects on it is created, enabling the representation of landscape relief, vegetation, buildings, and other features with high spatial accuracy.
Airborne laser scanning of the Ústí Region was carried out by AERIMAP as part of the TAČR project (Solar Potential of the Ústí Region: Data Backgrounds for the Development of Future Methodologies and Frameworks in the Energy Sector). The scanning took place during the summer months of 2024 (21 June – 29 July) and 2025 (22 June – 23 September) using VQ-1560 II-S and Riegl sensors.
The data are distributed in the form of an unclassified point cloud with a minimum density of 8 points/m², divided into tiles, in LAZ 1.4 format in the S-JTSK coordinate system (EPSG: 5514) and with elevation values in the Baltic Vertical Datum – After Adjustment (Bpv).
Digital Surface Model (DSM)
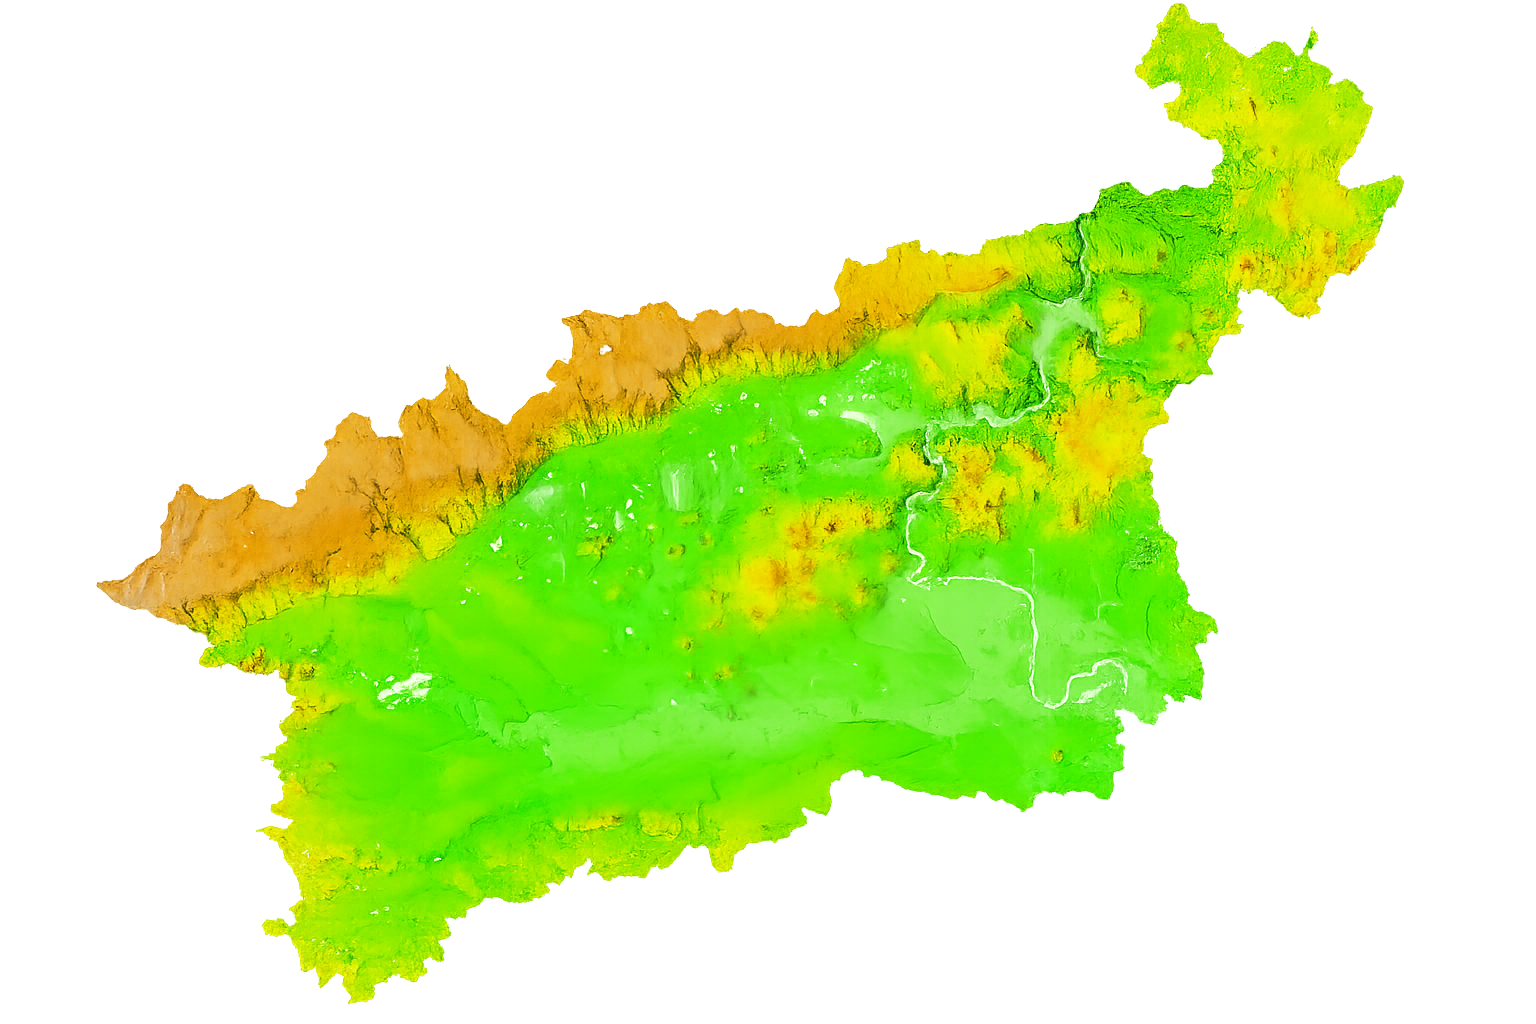
The Digital Surface Model (DSM) represents the topography of the Earth’s surface, including all objects located on it, especially vegetation, buildings, and linear structures such as pylons and high-voltage power lines. The DSM of the Ústí Region was created from a point cloud acquired using airborne laser scanning in 2024–2025 and represents the surface condition during this period. The DSM was generated using the first returns of the laser pulse after the removal of outlier points (noise). The output is a raster in TIFF format with a spatial resolution of 1 × 1 m in the S-JTSK coordinate system (EPSG: 5514) and with elevation values in the Baltic Vertical Datum – After Adjustment (Bpv). The DSM of the Ústí Region provides an alternative to the nationwide product DMP1G (Digital Surface Model of the Czech Republic, 1st Generation), which is already becoming outdated and will no longer be provided by the Czech Office for Surveying, Mapping and Cadastre (ČÚZK).
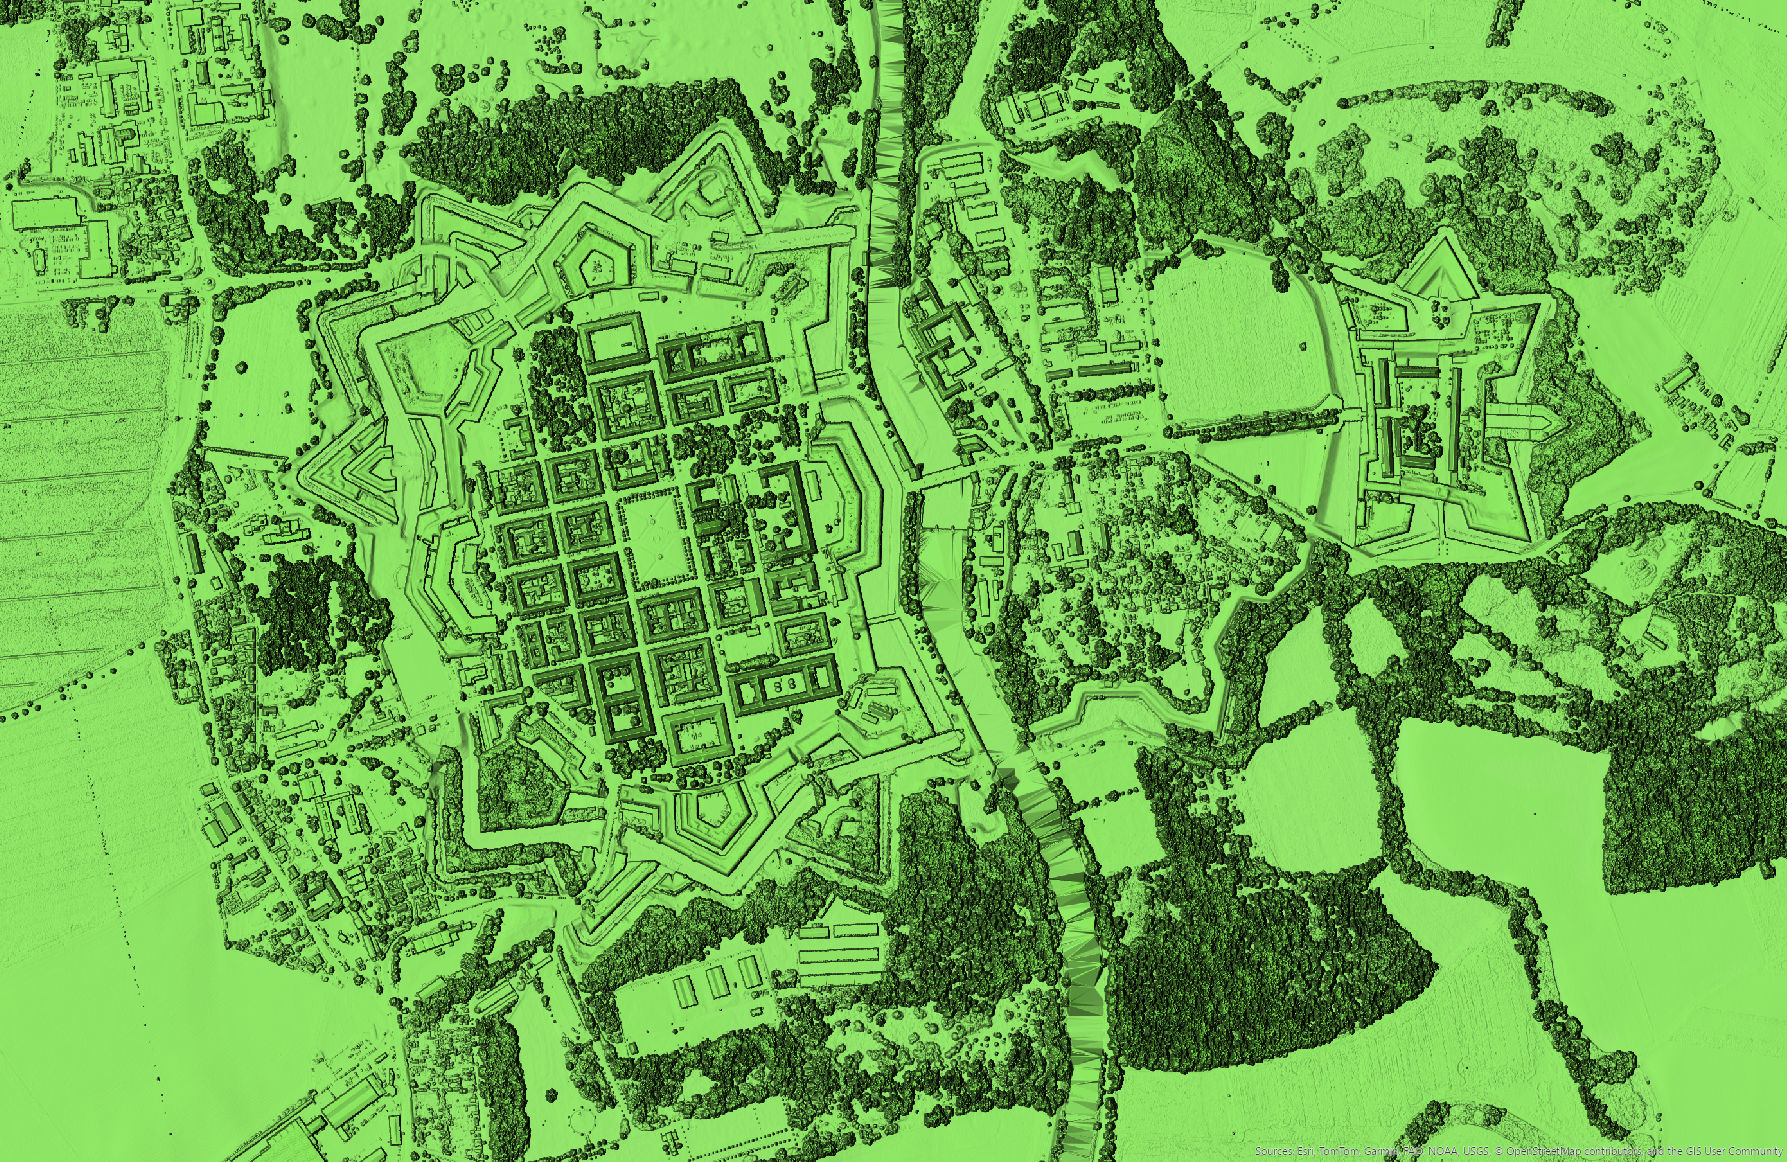
Terezín
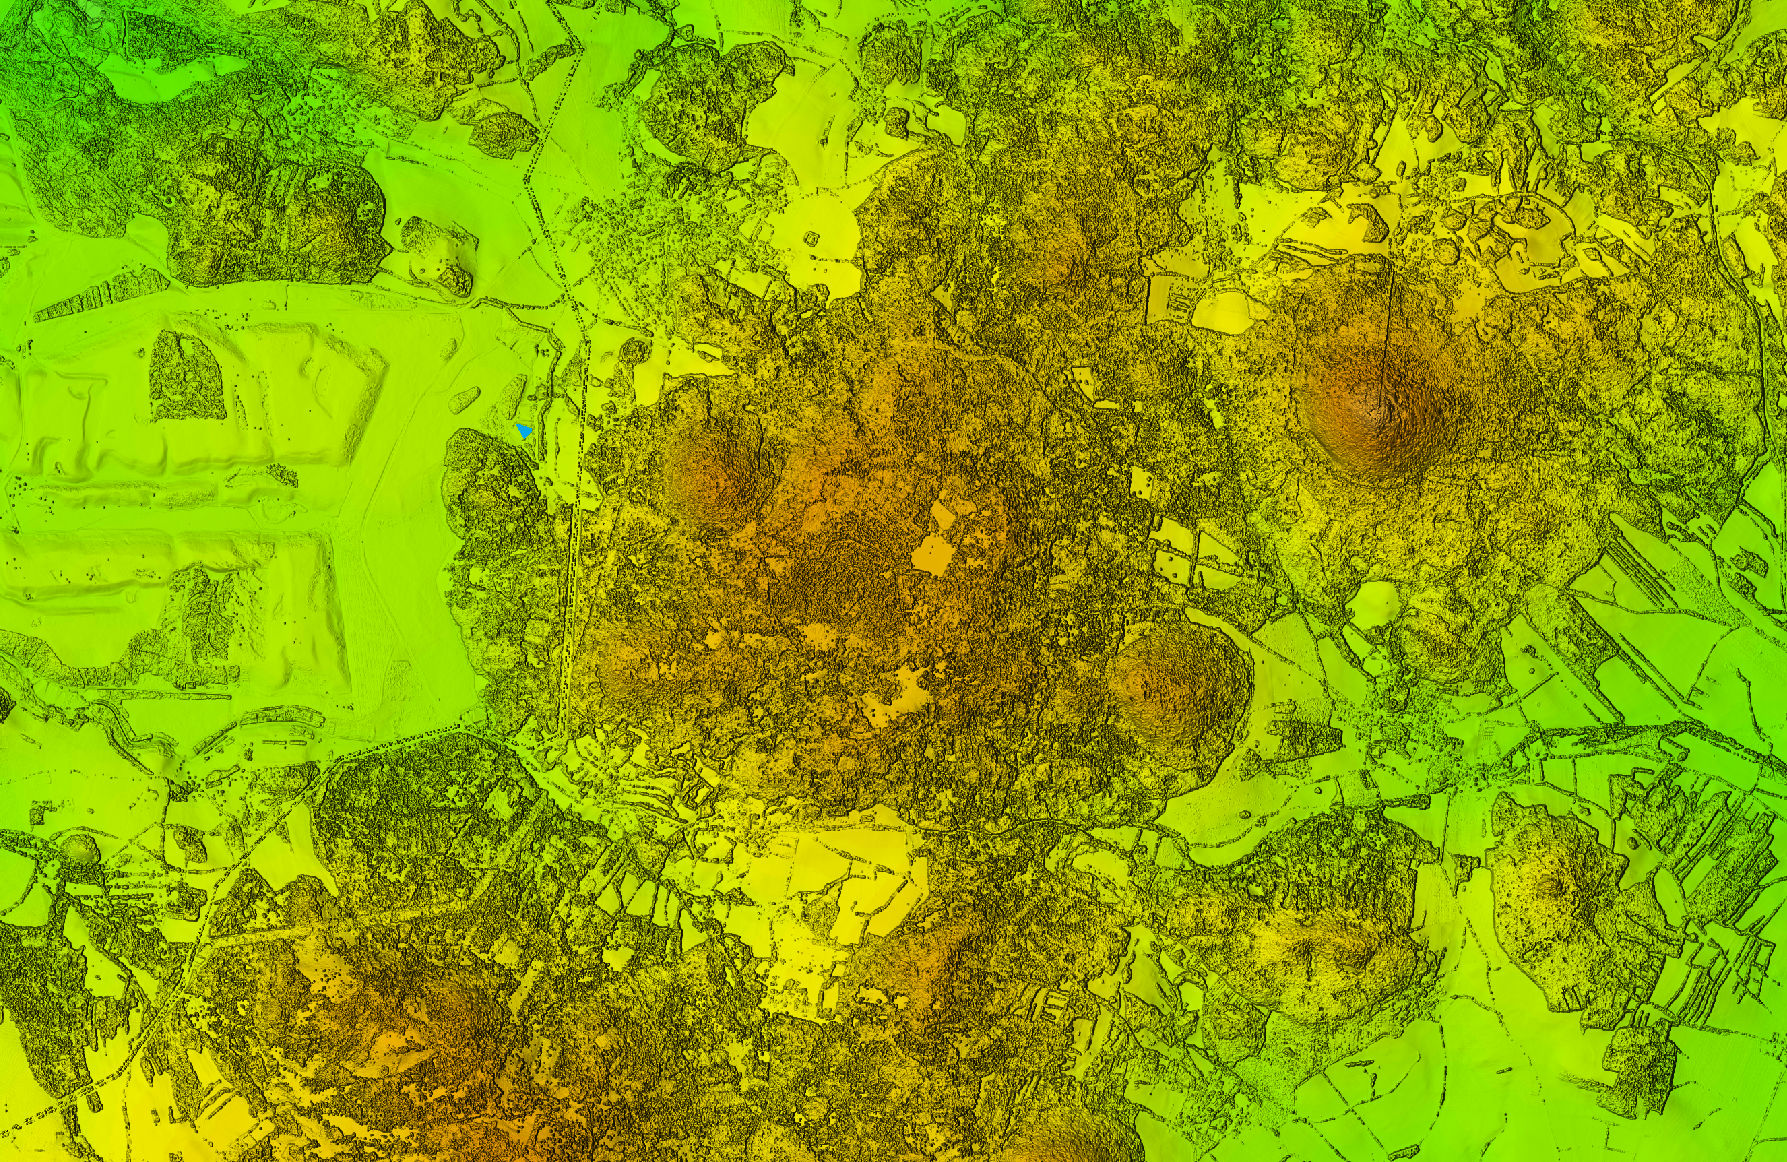
Milešovka a okolí
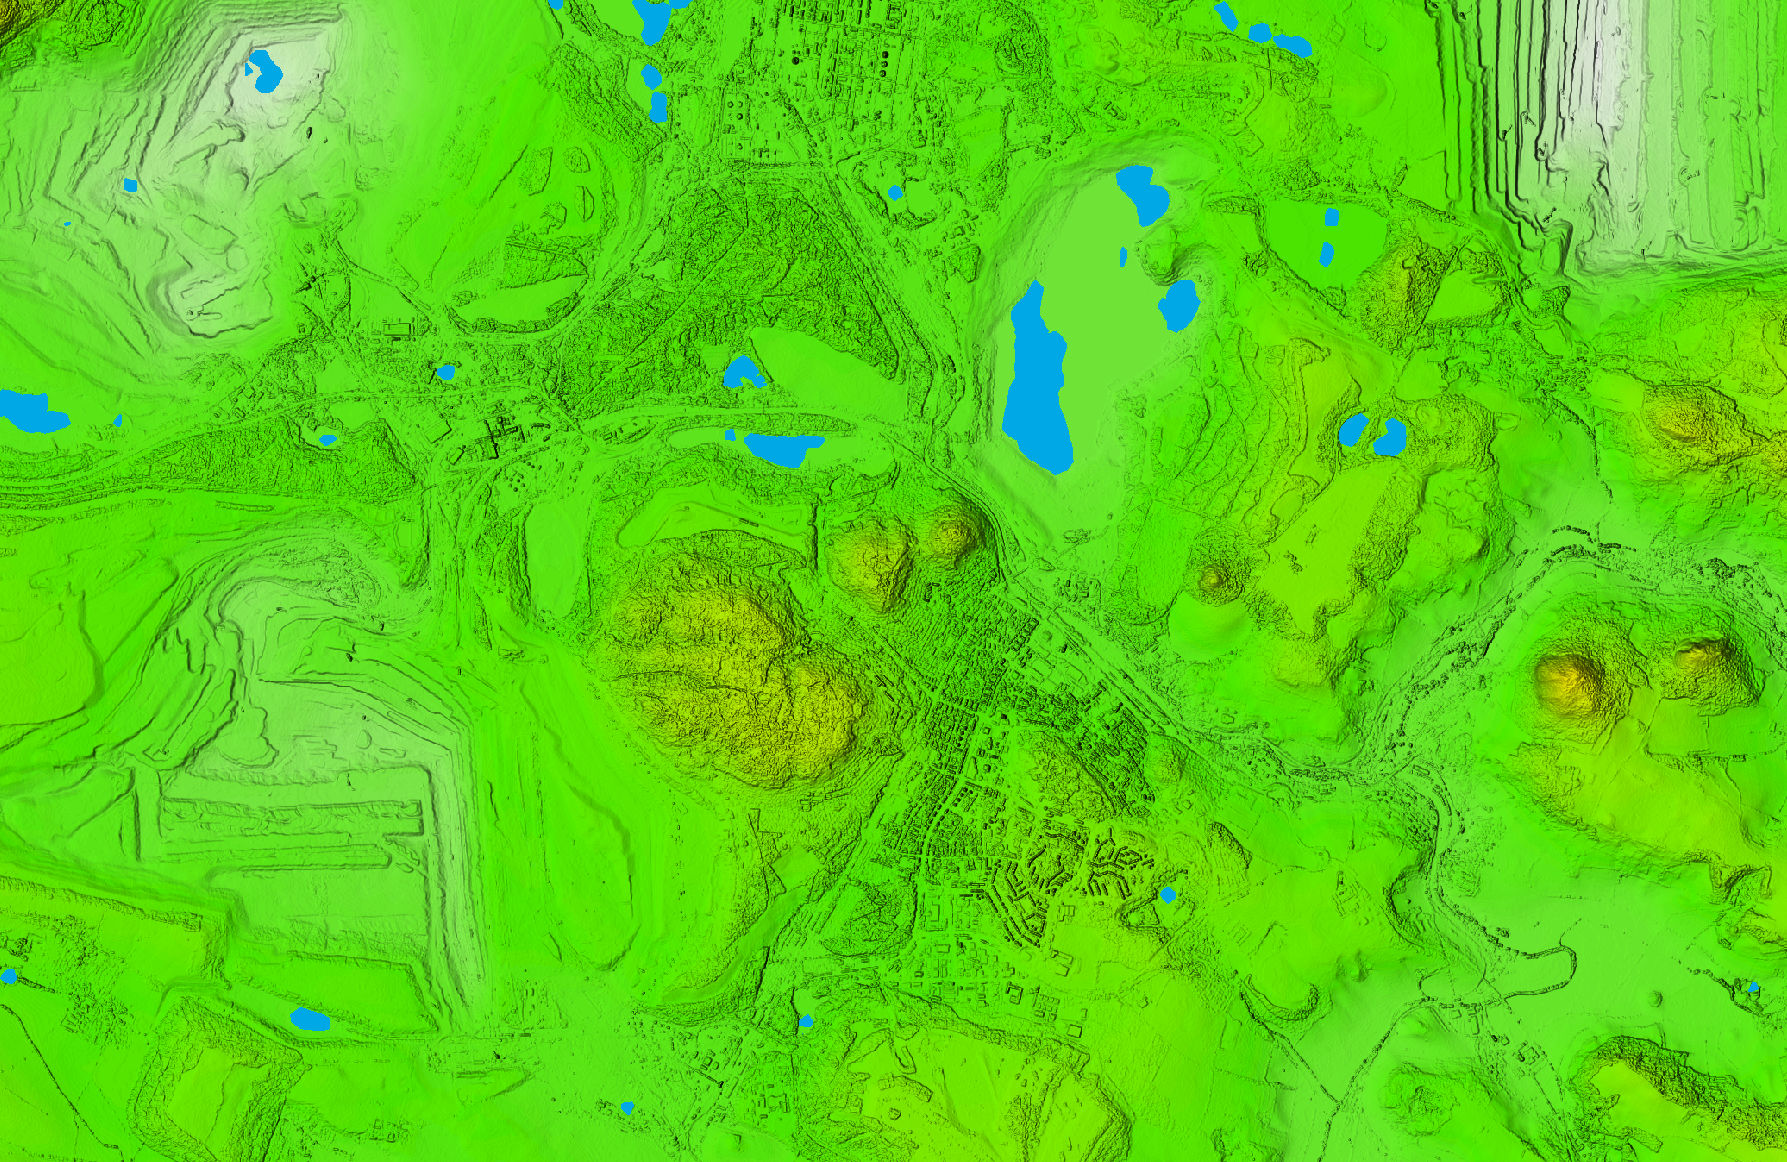
Most a okolí
Rooftop Solar Potential
Solar potential data for the Ústí Region are available for download in both raster and vector formats. The outputs include estimates of rooftop solar potential for individual scenarios and months of the year. More information about the calculation can be found in the Detailed Documentation of the Methodology (PDF).
Raster data are provided in GeoTIFF (.tif) format. The territory of the Ústí Region is divided into two parts based on the two phases of input data collection: Part 1 corresponds to the area that was airborne scanned in 2024, while Part 2 corresponds to the scanning carried out in 2025. In both cases, the rooftop solar potential calculation was performed for building polygons corresponding to the respective year.
Available datasets include rasters for individual months, scenarios, and territorial parts. The files are named irr_sc{X}_m{YY}_part{Z}.tif, where:
-
- X is the scenario number (1 – optimistic, 2 – realistic, 3 – pessimistic)
- Y is the month number (01 to 12)
- Z is the number corresponding to the part of the Ústí Region (1 – area from airborne acquisition in 2024, 2 – area from airborne acquisition in 2025)
For example, the file irr_sc3_m10_part2.tif corresponds to the radiation raster according to Scenario 3 (pessimistic) for October (month 10) in Part 2 of the Ústí Region (i.e. the area surveyed in 2025).
The downloadable data also include rasters of the total annual radiation according to the realistic scenario for both parts (irr_total_part1.tif, irr_total_part2.tif).
Vector data are distributed as a file geodatabase (Esri File Geodatabase, .gdb), which contains the following items: Feature class irradiance_polygons – geometry of all polygons from all processed tiles with the following attributes:
-
- IRRAD_TOT – total annual irradiance (sum of 12 months, Scenario 2, in Wh/m²)
- COMPOSITE_KEY – auxiliary key for linking with the table
Relational table irradiance_monthly – monthly irradiance values for each polygon (i.e. 12 rows per polygon) with the following columns:
-
- MONTH – month number (1–12)
- SCENARIO_1 / 2 / 3 – irradiance values for the three scenarios (1 – optimistic, 2 – realistic, 3 – pessimistic, in Wh/m²)
- COMPOSITE_KEY – auxiliary key for linking with the feature class
Relationship class rel_irradiance – links both items through COMPOSITE_KEY. The relationship is 1 polygon → 12 monthly records.